Understanding the Crypto Market Structure
The cryptocurrency market operates as a decentralized and continuously traded financial environment that differs in significant ways from traditional equity, bond, or commodity markets. Its structure is shaped by global participation, high volatility, evolving regulation, and a technological infrastructure based on blockchain networks. For traders and investors, understanding this structure is essential for evaluating opportunities, managing risk, and developing strategies that align with specific time horizons.
A comprehensive view of market structure requires close examination of how prices move, how liquidity is distributed, how participants interact, and how trends develop across multiple timeframes. While individual trading styles may vary, the principles governing price behavior remain grounded in supply and demand dynamics, liquidity concentration, and collective market psychology. By breaking these elements down into their components, market participants can interpret price action more effectively and apply appropriate strategies to different trading conditions.
Market Structure Basics
At its foundation, the crypto market structure revolves around price trends and the way these trends form through sequences of higher highs, higher lows, lower highs, and lower lows. An upward trend is characterized by consistent higher highs and higher lows, signaling that buyers are willing to enter the market at increasingly higher prices. A downward trend reflects the opposite pattern, where sellers dominate and successive price swings form lower highs and lower lows. A sideways or ranging market develops when price oscillates within a relatively defined horizontal band, without clear directional momentum.
These structural formations emerge due to the constant interaction between buyers and sellers. When buying pressure exceeds selling pressure, price moves upward until it reaches a level where sellers perceive value and begin to enter aggressively. Conversely, when selling pressure dominates, the market declines until value buyers step in. This balance and imbalance between supply and demand underpin all price action.
Crucial within this framework is the concept of support and resistance levels. Support refers to price zones where demand historically overcomes supply, resulting in halted declines or upward reversals. Resistance represents areas where selling pressure exceeds buying interest, often limiting upward progress. These levels are rarely exact price points; rather, they function as zones defined by prior market reactions, consolidation areas, or high-volume transactions.
In cryptocurrency markets, support and resistance levels can form rapidly due to volatility and can also break decisively when strong momentum enters the market. Breaks of established support or resistance frequently signal structural shifts. For example, when resistance is breached and price continues higher, the former resistance may transform into new support. This phenomenon occurs because traders reassess prior price levels and reposition accordingly.
Another essential element of market structure is liquidity. Liquidity determines how easily assets can be bought or sold without significantly impacting price. In deeper markets, such as major cryptocurrency pairs, liquidity tends to be concentrated around established price zones. In smaller or emerging tokens, liquidity may be limited, creating more abrupt and exaggerated price swings. Understanding liquidity conditions helps traders anticipate where price may accelerate or stall.
Market Participants and Structural Influence
The structure of the cryptocurrency market is influenced by diverse participants, including retail traders, institutional investors, algorithmic trading systems, miners or validators, decentralized finance users, and long-term holders. Each group contributes to the overall flow of orders and liquidity.
Retail traders often contribute to short-term volatility, especially during news events or periods of social media attention. Institutional participants, such as hedge funds or asset managers, typically operate with larger capital allocations and may accumulate or distribute positions over extended periods. Their activity can result in broader trends or sustained directional movements.
Algorithmic trading systems, increasingly common in crypto markets, respond to predefined conditions in milliseconds. They can amplify breakouts, capitalize on arbitrage opportunities, and influence short-term order flow. Because the crypto market trades continuously, automated systems play a significant role in price discovery across exchanges.
Long-term holders also shape structure by limiting circulating supply. When large quantities of assets are held in cold storage or staked in protocols, available supply decreases, potentially intensifying price reactions when demand shifts. Understanding how these participants engage with the market supports deeper structural interpretation.
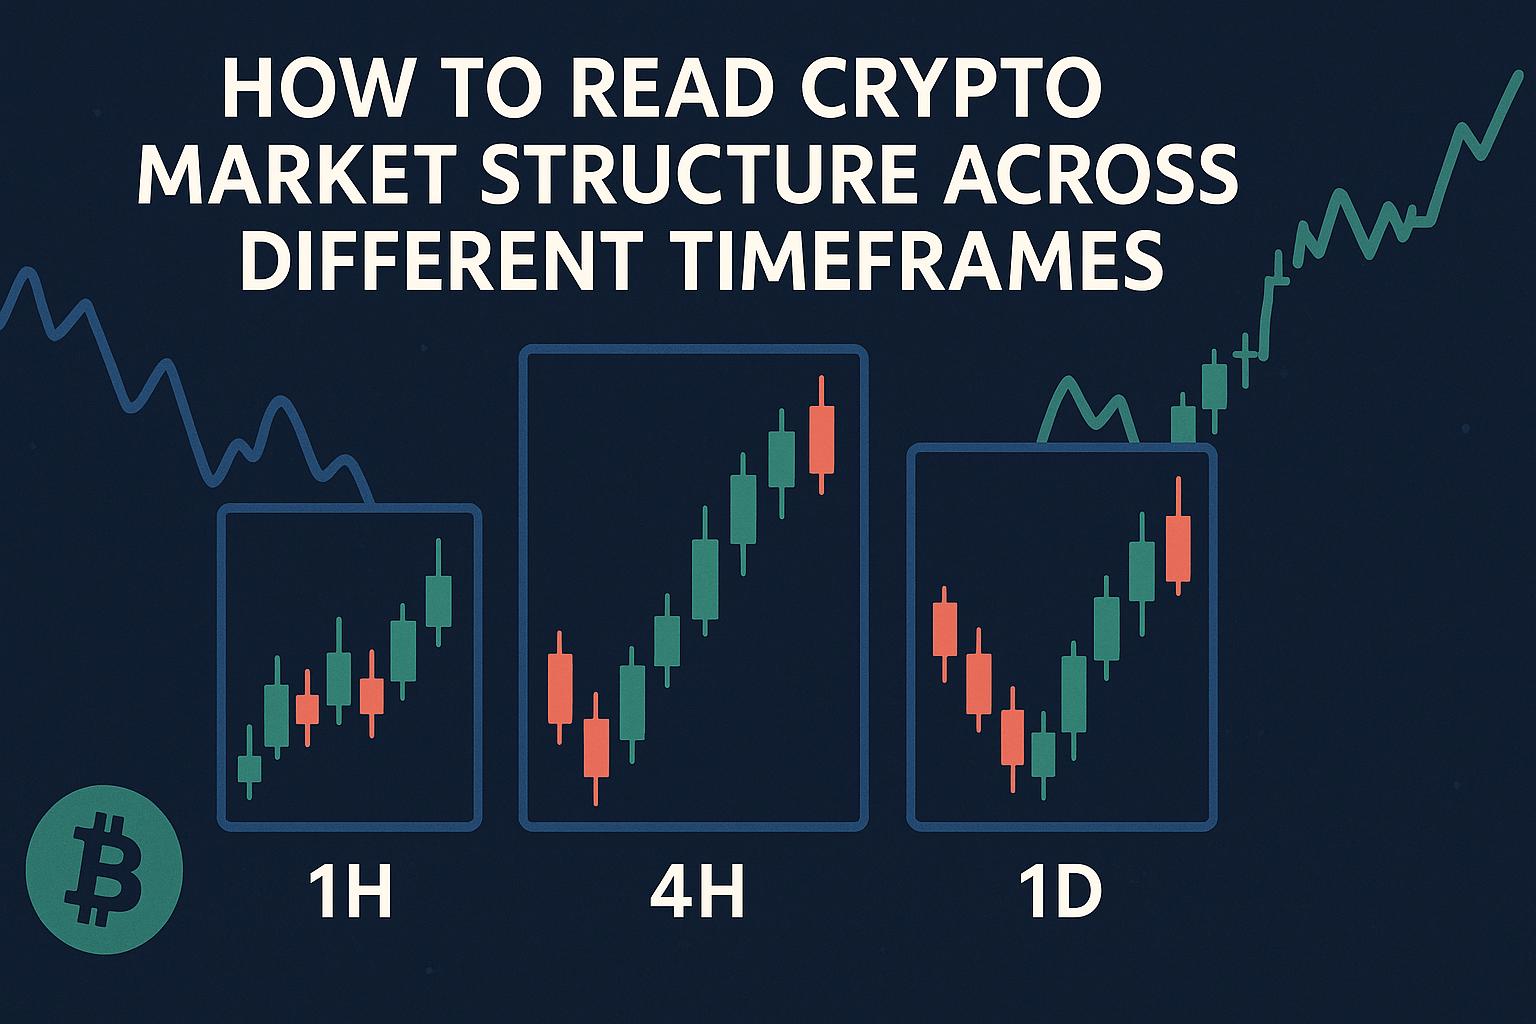
Analyzing Different Timeframes
Cryptocurrency markets can be evaluated across multiple time horizons, from very short intervals to multi-year perspectives. Each timeframe provides distinct information about trend development, volatility patterns, and risk exposure. A well-developed analytical approach typically integrates several timeframes rather than relying on a single perspective.
Timeframe analysis does not simply involve zooming in or out on a chart. It requires understanding how smaller patterns exist within larger ones. A short-term uptrend, for example, may occur within a longer-term downtrend. Recognizing this alignment or divergence between timeframes allows traders and investors to align strategies with prevailing structural forces.
Short-term Timeframes
Short-term timeframes, such as 5-minute, 15-minute, or 1-hour charts, are commonly used by day traders and scalpers who focus on capturing small price movements. On these charts, price action appears detailed and dynamic, often showing rapid shifts in momentum.
Within short-term frames, traders typically pay close attention to immediate support and resistance levels, micro-trend formations, and consolidation patterns. Breakout setups occur when price compresses within a narrow range, potentially signaling imminent expansion. Conversely, failure to break a level may result in sharp reversals.
Volume analysis plays a significant role on short-term charts. Spikes in trading volume often accompany breakouts or breakdowns, indicating strong participation. Conversely, low volume may signal indecision or an impending pause in movement. Traders may also observe order book activity to assess short-term liquidity clusters.
Because short-term trading exposes participants to rapid fluctuations, risk management must be tightly controlled. Stop-loss placement typically aligns with recent structural highs or lows, ensuring that positions are adjusted if a structural shift invalidates the initial thesis.
Medium-term Timeframes
Medium-term analysis frequently involves 4-hour and daily charts. These timeframes smooth out minor price fluctuations and highlight broader swing patterns. Traders operating in this range often aim to capture multi-day or multi-week movements.
Swing highs and lows become more pronounced on medium-term charts, offering clearer identification of trend structure. Moving averages are commonly applied to identify directional bias. For example, when price remains above a rising long-term moving average, the prevailing structural bias is typically upward. When it remains below a declining average, the trend may be considered bearish.
Medium-term traders also evaluate consolidation patterns such as flags, triangles, or rectangles. These formations represent pauses in trending movements and may precede continuation or reversal patterns. In cryptocurrency markets, these patterns can develop quickly, especially during news-driven volatility.
Risk management at this timeframe often involves wider stop placement compared to short-term trading. Because swings are broader, price requires more room to fluctuate before confirming structural invalidation.
Long-term Timeframes
Long-term analysis typically relies on weekly and monthly charts. These charts filter out most short-term noise and allow investors to evaluate multi-year cycles and macro trends. Such timeframes are particularly relevant in cryptocurrency markets, which have historically experienced pronounced boom-and-bust cycles.
On long-term charts, overarching trends become visible through large structural formations. Extended accumulation phases often precede prolonged upward expansions. Similarly, distribution phases may precede extended declines. Identifying these macro phases requires examining volume patterns, multi-year support and resistance zones, and broader economic conditions.
Major psychological levels often emerge on higher timeframes. Round numbers and historic peaks frequently serve as reference points for market participants. When price approaches previous cycle highs, increased volatility often follows due to profit-taking and renewed speculation.
Long-term investors may also examine on-chain data, token supply metrics, and network growth indicators to complement chart analysis. These data points offer insight into ecosystem development, adoption rates, and potential valuation drivers.
Structural Shifts and Breaks
A significant aspect of understanding market structure involves identifying structural breaks. A structural break occurs when the established pattern of highs and lows changes. In an uptrend, this may manifest as a failure to produce a higher high followed by a break below the previous higher low. In a downtrend, a structural shift may occur once price forms a higher high and breaks above prior lower highs.
Such events often indicate that control may be transitioning between buyers and sellers. However, not every break guarantees sustained reversal. False breakouts and temporary deviations are common in cryptocurrency markets due to volatility and liquidity imbalances.
To assess the strength of a structural shift, traders examine volume, follow-through price action, and higher timeframe alignment. When a breakout aligns with macro trend support and strong participation, its probability of continuation typically increases.
Volatility and Market Cycles
Cryptocurrency markets exhibit higher volatility than many traditional asset classes. This characteristic influences structure by accelerating both upward and downward movements. During expansion phases, prices may rise rapidly as demand outpaces available supply. During contractions, declines may be equally swift.
Market cycles often unfold through identifiable stages: accumulation, markup, distribution, and markdown. Accumulation occurs after extended declines, where informed participants gradually build positions. Markup represents sustained upward momentum. Distribution marks a transitional phase where early buyers begin to reduce exposure. Markdown follows as selling pressure intensifies.
Understanding these broader cycles enhances structural interpretation across timeframes. A short-term bullish pattern occurring during a long-term markdown phase may carry different implications than the same pattern forming during a macro accumulation stage.
Correlation and External Influences
Cryptocurrency market structure does not operate in isolation. Macroeconomic conditions, regulatory developments, technological advancements, and cross-market correlations influence price behavior. Bitcoin, as a dominant asset, often impacts the price structure of alternative cryptocurrencies. When Bitcoin establishes a strong upward or downward trend, correlated assets frequently follow.
Interest rates, liquidity conditions in global markets, and institutional involvement may also shape structural development. For example, tightening monetary policy can reduce risk appetite across financial markets, affecting crypto trends.
Evaluating correlations helps contextualize individual asset movements within broader structural dynamics.
Practical Application and Strategy
Applying market structure analysis requires aligning strategy with timeframe, risk tolerance, and objective. Short-term traders might focus on capturing momentum within well-defined intraday levels. Medium-term traders may emphasize swing structures and consolidation breakouts. Long-term investors may concentrate on macro cycles and structural milestones.
Multi-timeframe analysis is often integrated into practical decision-making. A trader may identify a long-term upward bias on a weekly chart, confirm medium-term higher lows on a daily chart, and execute entries on short-term pullbacks. This alignment enhances consistency between structural analysis and tactical execution.
Risk management plays a central role in any structurally based strategy. Clear invalidation points, position sizing, and diversification contribute to preserving capital during unexpected market shifts.
Continuous evaluation of structural conditions is also necessary. Cryptocurrency markets evolve rapidly due to technological innovation, regulatory changes, and adoption trends. What characterizes a bullish environment in one period may differ in another.
Conclusion
Understanding the crypto market structure involves more than observing price direction. It requires analyzing trends, identifying support and resistance zones, interpreting liquidity distribution, and integrating multiple timeframes. Structural awareness allows traders and investors to interpret price movements within broader contexts, anticipate potential shifts, and manage exposure systematically.
By studying how short-term fluctuations interact with medium-term trends and long-term cycles, participants can develop a coherent framework for navigating the volatility inherent in digital asset markets. Consistent practice, disciplined risk management, and adaptation to evolving conditions remain fundamental to sustaining performance within this dynamic financial landscape.
This article was last updated on: May 15, 2026