Understanding Market Conditions: Trending vs. Range-Bound
Identifying the prevailing market condition is a foundational skill for participants in cryptocurrency markets. Price behavior does not move randomly; it tends to organize itself into recognizable phases. Broadly, market environments can be categorized as trending or range-bound. Each condition reflects a distinct balance between buyers and sellers and requires different analytical tools and trade management approaches.
A trending market is characterized by sustained directional movement, either upward or downward, over a period of time. In an uptrend, buyers consistently exert more pressure than sellers, pushing price levels progressively higher. In a downtrend, selling pressure dominates, leading to lower highs and lower lows. In contrast, a range-bound market, sometimes referred to as a sideways or consolidating market, lacks clear direction. Price oscillates within defined boundaries, reflecting relative equilibrium between supply and demand.
Understanding these patterns allows traders to adapt strategies rather than applying a single method in all conditions. Misinterpreting a range as a trend, or vice versa, often leads to inconsistent results. A structured approach to identifying market type can reduce this risk.
Structural Characteristics of Trending Markets
Trending markets exhibit identifiable structural features. In an uptrend, price forms a sequence of higher highs and higher lows. Pullbacks occur, but each successive retracement typically finds support above the previous one. In a downtrend, the pattern reverses, forming lower highs and lower lows.
Volume behavior can reinforce the trend. Expanding volume during impulse moves in the direction of the trend and contracting volume during pullbacks often suggests sustained participation. Conversely, declining volume in a mature trend may indicate weakening momentum and a possible transition to consolidation.
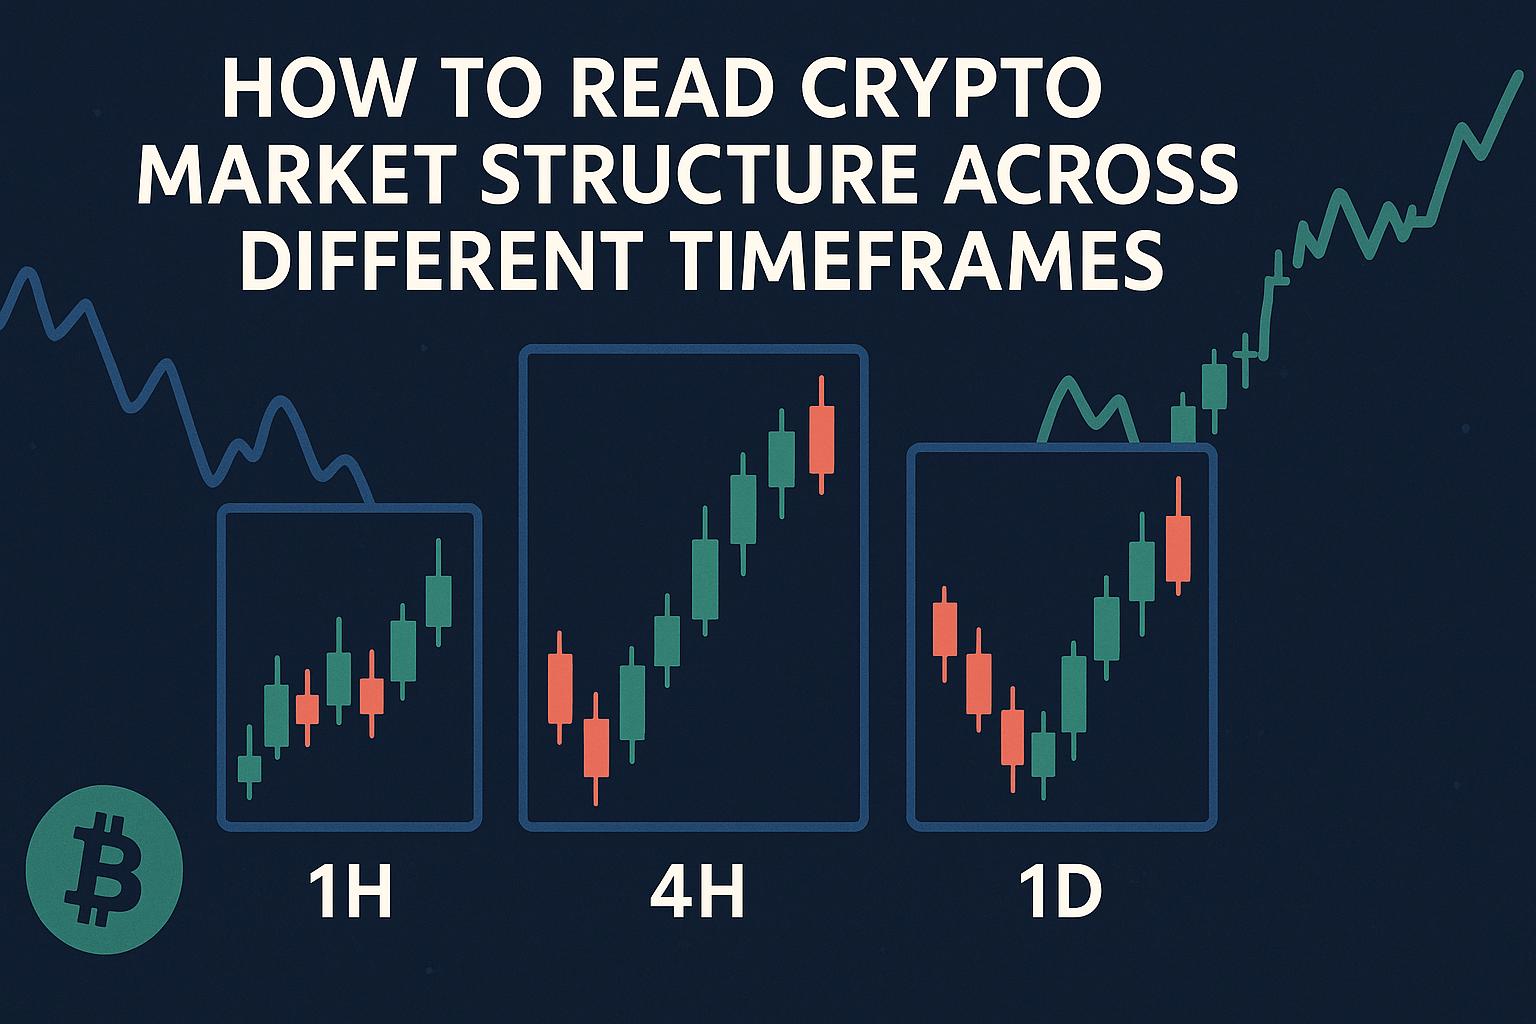
Timeframe analysis is also relevant. A market may trend on a daily chart while remaining range-bound on an intraday timeframe. Traders should align their strategy with the timeframe they are operating in and verify that the broader context supports their directional bias.
Identifying Trending Markets with Indicators
Technical indicators provide quantitative tools to support visual analysis. Moving averages are among the most widely used methods for assessing trend direction. A simple moving average (SMA) calculates the average closing price over a defined period, while an exponential moving average (EMA) gives greater weight to recent price data.
When price consistently trades above a rising moving average, this condition supports the interpretation of an uptrend. When price remains below a declining moving average, it suggests a downtrend. The slope of the average provides additional context. A flat moving average may indicate consolidation rather than trending behavior.
Combining multiple moving averages can improve clarity. For example, comparing a 50-period moving average with a 200-period average helps assess medium- and long-term direction. Sustained separation between the two averages often signals a strong trend, while repeated crossovers may indicate choppy, range-bound conditions.
The Average Directional Index (ADX) is another tool used to measure trend strength. Unlike directional indicators, ADX does not indicate whether the trend is up or down. Instead, it evaluates the intensity of the trend. Higher ADX readings generally correspond to stronger trends, while low values suggest non-trending markets.
Trading Strategies for Trending Markets
In trending markets, traders aim to align positions with the prevailing direction. The guiding concept is that established trends have a greater probability of continuation than immediate reversal. This does not eliminate risk, but it aligns trades with the dominant flow of capital.
Trend-following strategies involve identifying retracements within a trend and entering trades in the direction of that trend. Rather than buying at new highs in an uptrend, traders often wait for controlled pullbacks to areas of support such as moving averages or previously broken resistance levels. This approach can improve risk-to-reward ratios by reducing distance to invalidation points.
Momentum trading is related but distinct. Momentum traders focus on assets demonstrating strong recent performance. They assume that relative strength or weakness will persist over short to medium horizons. Indicators such as the Moving Average Convergence Divergence (MACD) or rate-of-change calculations help evaluate acceleration in price movement.
Risk management plays a central role in trending conditions. Even strong trends experience sharp reversals. Stop-loss placement often follows structural levels such as the most recent swing low in an uptrend or swing high in a downtrend. Trailing stops may also be used to lock in gains as the trend evolves.
Example Strategy: Moving Average Crossover
A moving average crossover system uses two averages of different lengths, typically one short-term and one long-term. The shorter average reacts more quickly to price changes, while the longer average smooths out fluctuations.
When the short-term average crosses above the long-term average, it suggests that recent price action is strengthening relative to the broader trend. This event may serve as a buy signal. Conversely, when the short-term average crosses below the long-term average, it may signal potential weakness and serve as a sell or exit signal.
Although this strategy is systematic and easy to apply, it performs best in sustained trending environments. In sideways markets, frequent crossovers can produce false signals. Therefore, traders often combine crossover systems with trend-strength filters such as ADX thresholds to reduce whipsaw losses.
Transition Phases Between Trends and Ranges
Markets frequently rotate between expansion and contraction phases. After an extended trend, price may enter a consolidation period as participants reassess valuations. During this time, volatility often decreases, and the market forms a range.
Similarly, prolonged range-bound conditions may eventually resolve into breakouts. A breakout accompanied by increased volume and volatility can signal the emergence of a new trend. Recognizing these transitions is critical. Entering a trend-following trade late in its lifecycle or attempting mean-reversion during early breakout stages can reduce effectiveness.
Volatility indicators, such as Bollinger Bands, help track contraction and expansion cycles. Narrowing bands often precede significant moves, while expanding bands confirm increased volatility associated with trending activity.
Understanding Range-Bound Markets
Range-bound markets reflect temporary equilibrium between buyers and sellers. Price oscillates within horizontal support and resistance boundaries without establishing a sustained directional path. This condition often appears after strong trends or during periods of reduced external catalysts.
Within a range, price tests the lower boundary, known as support, where buying interest has historically emerged. It also tests the upper boundary, known as resistance, where selling pressure tends to increase. As long as these levels hold, market participants may repeatedly trade the oscillations.
Range-bound markets often display lower directional volatility but can still involve significant intraday fluctuations. Patience and precise entry timing become important, as trades aim to capture shorter moves compared to trending environments.
Identifying Support and Resistance Zones
Support and resistance are not precise price points but zones representing concentrated supply or demand. They form through repeated interactions at similar price levels. When price approaches support, traders monitor for signs of stabilization, such as slowing momentum or reversal candlestick patterns. At resistance, they assess whether buying pressure weakens.
The more frequently a level is tested without breaking, the more established it becomes. However, repeated tests can also weaken the level over time. A decisive break beyond support or resistance may indicate a shift from range-bound to trending conditions.
Volume patterns provide further confirmation. Declining volume near range boundaries may suggest exhaustion, while rising volume during a breakout may validate the move.
Trading Strategies for Range-Bound Markets
In range-bound environments, traders often apply mean-reversion principles. The assumption is that price fluctuates around an average value and tends to revert after reaching short-term extremes.
Participants may buy near support and sell near resistance, maintaining relatively tight stop-loss orders beyond the established range. Because targets lie within the range rather than beyond it, profit expectations are typically smaller but more frequent.
Oscillators are frequently used in this context. The Relative Strength Index (RSI) measures the speed and magnitude of price changes. When RSI moves into overbought territory near resistance, it may support a short position. When it enters oversold territory near support, it may reinforce a long position. However, oscillators should not be used in isolation, especially during emerging trend phases where overbought or oversold readings can persist.
Example Strategy: Support and Resistance with RSI Confirmation
A practical method for trading ranges combines horizontal level analysis with oscillator confirmation. First, the trader identifies clearly defined support and resistance zones using historical price data. Next, they observe RSI behavior as price approaches these zones.
If price tests support and RSI registers an oversold reading, the trader may enter a long position with a stop below support. The target would be set near resistance. Similarly, if price approaches resistance while RSI indicates overbought conditions, a short position may be considered, with risk managed above the resistance level.
This approach seeks alignment between structural and momentum signals. It remains dependent on the continued validity of the range. A breakout beyond established boundaries requires reassessment and often a shift in strategy.
Risk Management Across Market Conditions
Regardless of whether the market is trending or range-bound, disciplined risk management remains central. Position sizing should reflect account size, volatility, and stop distance. Higher volatility environments generally require smaller position sizes to maintain consistent risk exposure.
Stop-loss placement differs by condition. In trending markets, stops are often positioned beyond structural swing points. In range-bound markets, they are typically placed just outside range boundaries. Traders may also adjust risk-to-reward ratios according to context, seeking larger multiples during strong trends and more modest targets during consolidation.
Psychological discipline is equally significant. Trending markets may encourage overconfidence, particularly during extended rallies. Range-bound markets may induce frustration due to frequent reversals. A structured plan helps mitigate reactive decision-making.
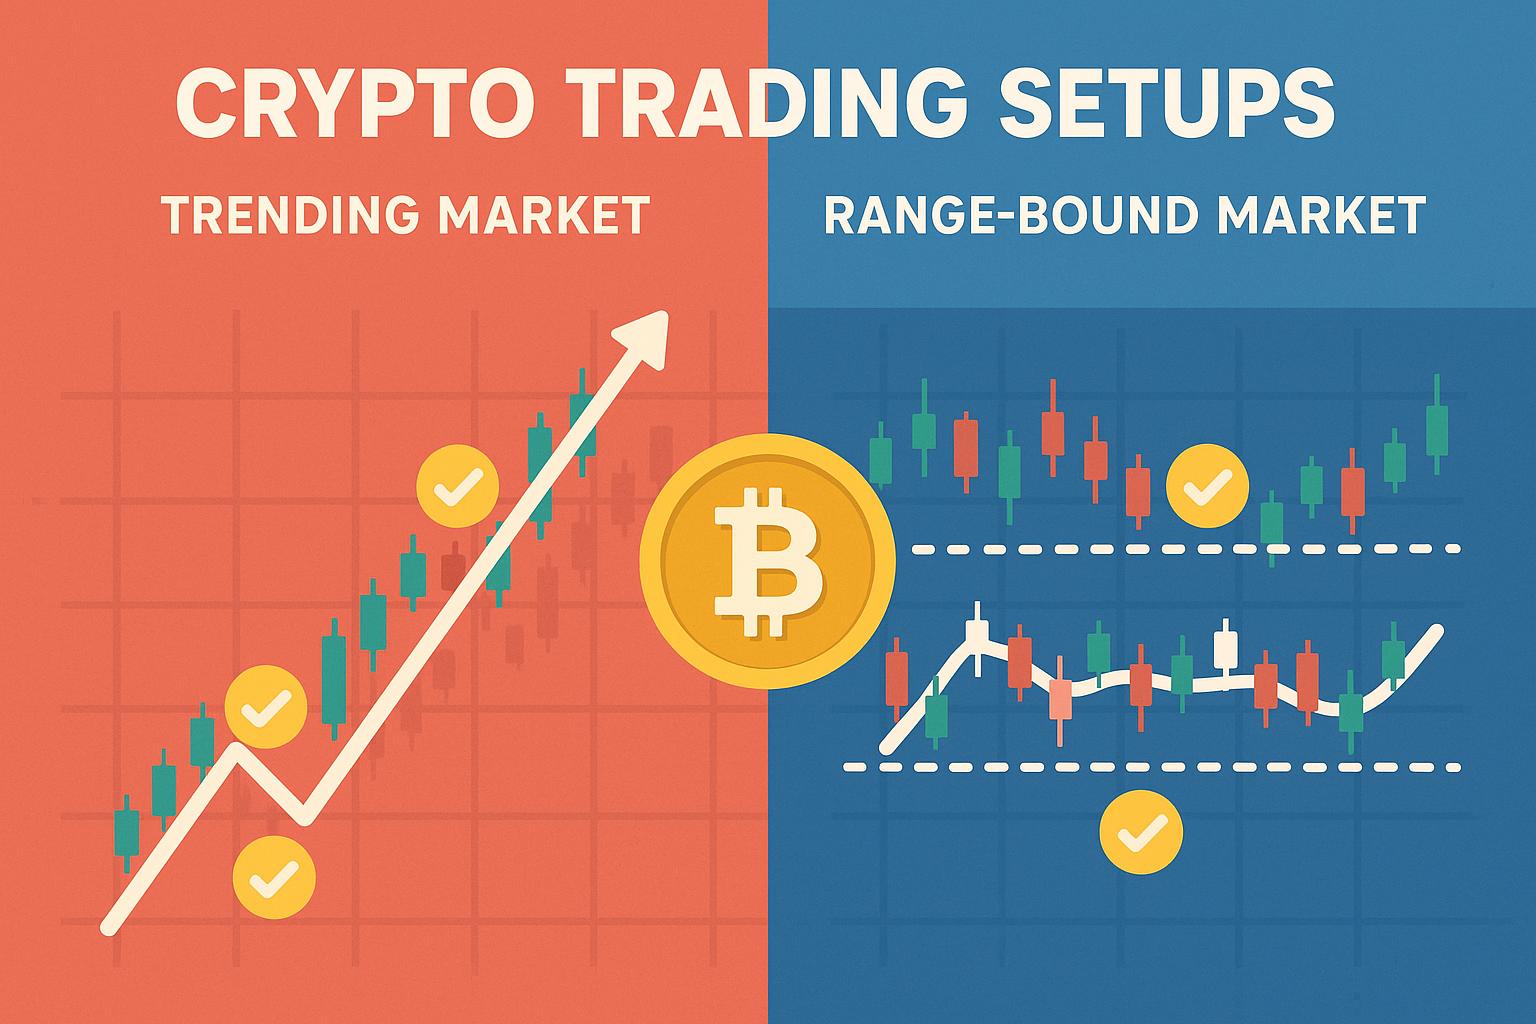
Choosing the Right Setup
Selecting an appropriate trading setup depends on accurate assessment of the prevailing market environment. Trend-following systems are designed to capture directional persistence, while mean-reversion systems attempt to exploit temporary imbalances within stable ranges. Applying the wrong approach to the wrong condition can undermine performance.
A well-rounded trader understands that no single strategy performs optimally in all scenarios. By evaluating price structure, indicator behavior, volatility patterns, and volume characteristics, it becomes possible to classify the market with greater reliability. Continuous reassessment is necessary, as conditions evolve.
In cryptocurrency markets, where volatility can shift rapidly due to macroeconomic events, regulatory developments, or liquidity changes, adaptability is particularly important. Traders who integrate condition-based analysis into their process can refine entries, exits, and risk parameters according to objective criteria rather than fixed assumptions.
Understanding the distinction between trending and range-bound markets provides a framework for strategic flexibility. By aligning tools and techniques with the current environment, traders can approach market participation with greater analytical clarity and operational consistency.
This article was last updated on: June 14, 2026